Debug Network issues from the outside using NLNOG Ring

Having CLI access to remote servers from external operators to run commands like ping, traceroute, mtr, etc., makes the troubleshooting proccess easier. A point of view outside your network is essential when trying identify latency, packet loss or connectivity issues between your IPs and the Internet. Thanks Job Snijders and the NLNOG community for making the ring possible.

What is NLNOG Ring?


NLNOG Ring is a community of network operators that share a virtual linux machine within their network. All members have access to all the servers that are part of the project and you can run commands from multiple servers at the same time. Some examples of what you can do in the ring:

  • Run a traceroute from 10 remote servers to a specific IP and paste the output to pastebin in jpg format
  • Ping an IP from N remote servers and see the latency per server
  • Run DNS queries from remote servers
  • Send http requests from remote servers to a specific IP
  • Validate AS-PATH and BGP routing information from web based looking glass 


NLNOG Ring in numbers

  • 416 organizations
  • 496 servers
  • 426 ASNs
  • Members from 56 countries


Participation

The requirements to participate are:


  • Your organisation has its own ASN, IPv4 and IPv6 prefix(es).
  • You are a network operator
  • The organisation you work for has BGP routers connected to the ”Default Free Zone” and maybe even IXP’s.
  • You have enable or configure rights on those routers.
  • You are involved in the networkers community.
  • You have permission from your organisation to become involved in the NLNOG RING.


Examples

1.- Ping Google DNS server from 10 random servers

Command:  ring-ping -n 10 -d -i -t 8.8.8.8


NewImage

2.- Run trace route to Google DNS from 15 remote random servers and display the trace information in JPG

Command: ring-trace 8.8.8.8 -n 15 -vv -b
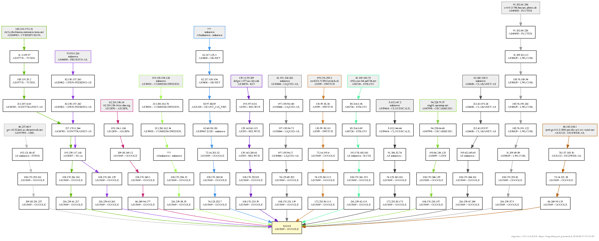
Image URL


Fxrh8p7vuydch41


Other tools

MyLG

Nmap

Tcpdump

Iperf

hping3


Latency Analysis using Grafana and raintank-probe

Real time and historical latency analysis in a Telco environment is an important troubleshooting tool that can help the NOC and Ops teams to identity networking issues. Issues like fiber cuts, errors in backbone links, wrong configuration in routing protocols and link saturations can affect customers applications running over those links. Being able to proactively identify issues before customers applications are affected due to latency or packet loss is one of the most important activities of NOC teams.

Typical monitoring tools (Opensource based open Nagios or commercial ones like Solarwinds, Zabbix, etc) are centralized and usually only provide ICMP analysis from one or two geographic locations which is not enough when trying to identify latency between the different markets or POPs.

There are several commercial and open source solutions that allow you to deploy internal probes in such a way that you can send ICMP tests every 60 seconds and send alarms via email or web hooks to a chat application like slack or Hangouts chats. An interesting one is Worldping which is a cloud based solution that can be integrated as plugin with Grafana and have the following advantages:

  • Cloud based
  • You don’t have to deploy an internal VM or public cloud VM and install Linux and Grafana
  • Grafana upgrades
  • Hosted Grafana supports community plugins which means that can be used not only for Worldping
  • Additional to ICMP tests the probe supports DNS, HTTP and HTTPS
  • You can use external probes additional to the private ones

Steps to deploy a hosted Grafana with Worldping plugin:

  1. Create an account in grafana.net
  2. Install and enable Worldping plugin the the hosted Grafana
  3. Install raintank in the internal probes. You can use any Linux server, either a vm or baremetal server or use a Raspberry Pi with Raspbian. Make sure that Go is installed
  4. Create API Key
  5. Configure key in internal probes under probe.ini and start daemon
  6. Configure Internal probes in Worldping (Should appear automatically if the probe list is key was configured correctly)
  7. Configure Endpoints in Worldping
  8. Configure alarms
  9. Enjoy and share dashboards with your team

Grafana Dashbaord example

Other commercial and open source alternatives:

Thousand eyes

PRTG

Vaping (Interesting alternative to Smokeping based on Python)

%d bloggers like this: